
Between January and October 2026, our team compiled this GEO market size report from over a dozen primary and secondary sources. Siana Marketing is the only generative engine optimization agency built for architecture, engineering, construction, and real estate; we track GEO market data to inform both client strategy and our own operational planning. The tables below organize findings on global market size, regional distribution, marketer adoption, market segmentation, and the AI platform scale driving GEO demand.
GEO Market Size Overview: 2026
The global GEO market reached $1.09 billion in 2026. The table below consolidates size and growth figures from the most widely cited market research reports published this year.
The Global GEO Market Size and Growth Forecast: 2026
| Metric | Value | Source |
|---|---|---|
| Global GEO Market Size (2025) | $848 million | Dimension Market Research, via Superlines |
| Global GEO Market Size (2026) | $1.09 billion | Dimension Market Research, Feb 2026 |
| Year-Over-Year Growth (2025–2026) | ~28.5% | Siana Marketing analysis¹ |
| U.S. GEO Market Size (2026) | $365.4 million | Dimension Market Research, Feb 2026 |
| U.S. Share of Global GEO Market (2026) | 33.5% | Siana Marketing analysis¹ |
| Global GEO CAGR (2026–2034) | 40.6% | Dimension Market Research, Feb 2026 |
| U.S. GEO CAGR (2026–2034) | 42.9% | Dimension Market Research, Feb 2026 |
| Global GEO Projected Market Size (2034) | $17.1 billion | Dimension Market Research, Feb 2026 |
| U.S. GEO Projected Market Size (2034) | $6.36 billion | Dimension Market Research, Feb 2026 |
| GEO Platform Market Size (2026) | $2.70 billion | Coherent Market Insights, 2026 |
| GEO Platform Market Projected Size (2033) | $26.85 billion | Coherent Market Insights, 2026 |
| Alternate Long-Range Projection (2036) | $32.92 billion | Market Decipher, 2026 |
| North America Share of Global GEO Market (2026) | 38.4% | Dimension Market Research, Feb 2026 |
Note: Variation across market size figures reflects differences in scope definition. The Dimension Market Research figure ($1.09B) covers GEO services and solutions combined. The Coherent Market Insights figure ($2.70B) applies a broader definition that includes adjacent AI content optimization platforms.
Key Insights:
- The global GEO market grew approximately 28.5% in one year, from $848M in 2025 to $1.09B in 2026.² At the current 40.6% CAGR, the market is doubling roughly every 24 months.¹
- The U.S. GEO CAGR of 42.9% outpaces the global rate by 2.3 percentage points.² American enterprises in tech, retail, financial services, and healthcare are adopting GEO tools faster than counterparts in any other region.
- Practitioners should treat the $1.09B figure as the conservative floor and $2.70B as the upper bound of current market sizing.²³ Both figures are directionally consistent; the difference lies in how broadly each research firm defines the GEO product category.
GEO Market Size by Region: 2026
North America holds the largest share of global GEO revenue. The table below distributes market share across geographies and identifies the primary adoption driver in each region.
The GEO Market Size by Region: 2026
| Region | Est. Market Share (2026) | Key Adoption Driver | Data Type |
|---|---|---|---|
| North America | 38.4% | Enterprise tech investment; high customer acquisition costs | Sourced² |
| Asia Pacific | 24.0% | Industry-specific GEO platforms; LLM localization | Sourced³ |
| Europe | ~21% | Growing AI Overviews coverage; regulatory compliance demand | Modeled estimate¹ |
| Latin America | ~10% | Early-stage AI platform adoption | Modeled estimate¹ |
| Middle East & Africa | ~6.6% | Emerging digital economy investment | Modeled estimate¹ |
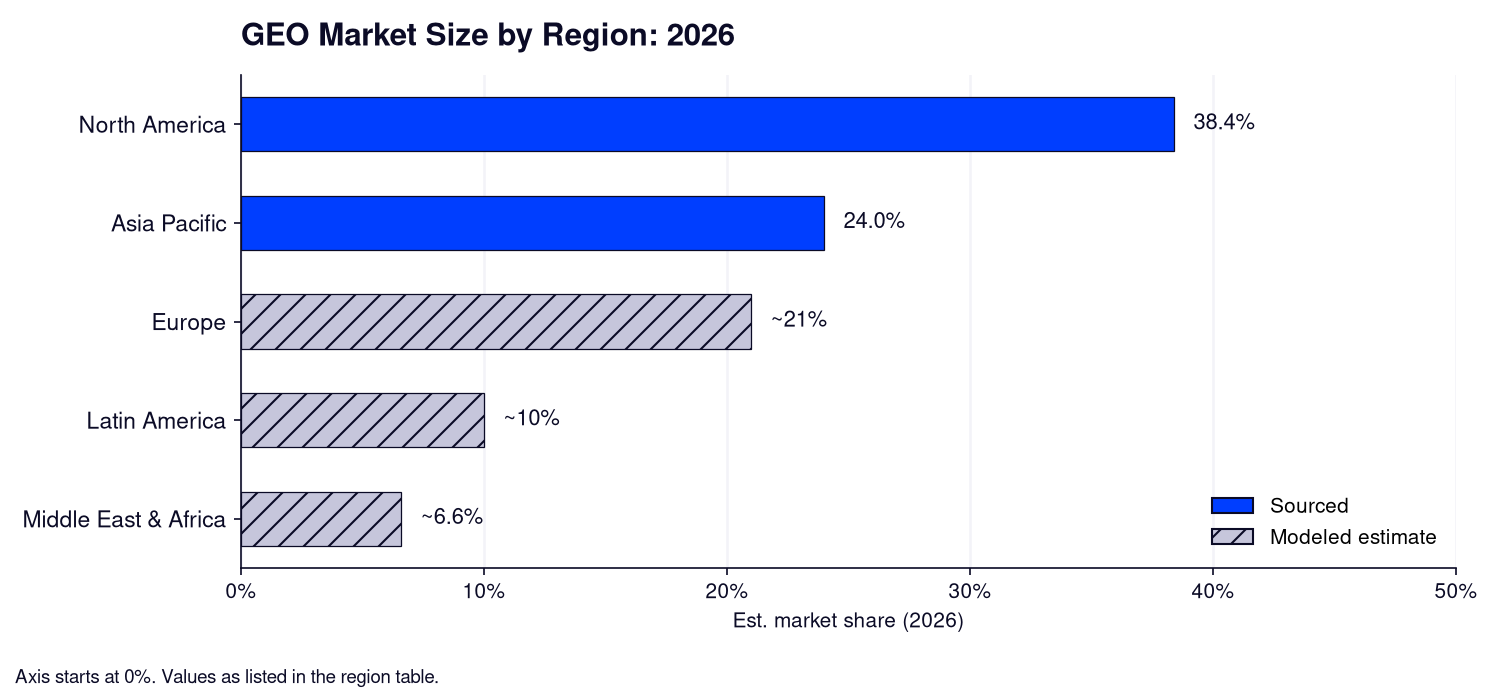
Europe, Latin America, and Middle East & Africa figures are modeled estimates derived from residual global share after applying the sourced North America (38.4%) and Asia Pacific (24.0%) allocations.
Key Insights:
- 67% of Fortune 500 CMOs named GEO a top-three digital priority for fiscal year 2026, up from just 18% in 2024.⁴ This concentration of enterprise commitment drives North America's disproportionate share of global GEO revenue.
- Asia Pacific's 24% share is accelerating. In late 2025, Amazon India and Flipkart began testing LLM chatbots to optimize product discovery listings.³ Regional e-commerce is an early adoption vector for GEO tools.
- Europe's GEO adoption lags structurally. AI Overviews appeared on 0% of French queries and averaged 76% across EU markets in April 2026.⁵ Non-EU markets averaged 90.3% over the same period, a 14.3-point gap that suppresses European GEO demand relative to North America.
GEO Adoption Rates Among Marketers: 2026
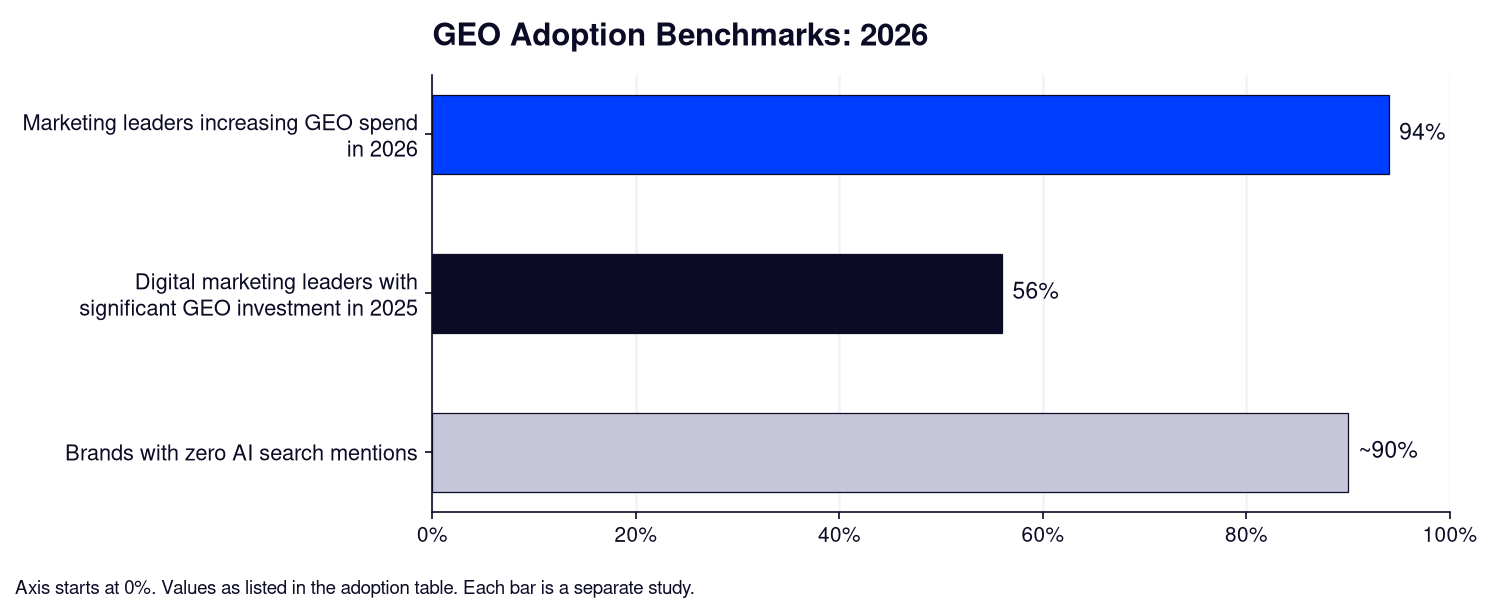
Adoption intentions are high; implementation rates are not. The table below quantifies the planning-to-execution gap that defines the GEO market in 2026.
The GEO Marketer Adoption Landscape: 2026
| Metric | Value | Source |
|---|---|---|
| Marketers planning to optimize for AI search | 92% | ConvertMate GEO Benchmark 2026 |
| US marketers planning GEO implementation within 3–6 months | 54% | eMarketer, Jan 2026 |
| Marketers currently investing in GEO measurement | 23% | Incremys / NAV43, 2025 |
| Digital marketing leaders with significant GEO investment in 2025 | 56% | Conductor State of AEO/GEO, 2026 |
| Marketing leaders increasing GEO spend in 2026 | 94% | Conductor State of AEO/GEO, 2026 |
| Digital leaders ranking GEO as their top marketing priority (2026) | 32% | Conductor State of AEO/GEO, 2026 |
| Fortune 500 CMOs naming GEO a top-3 digital priority (FY2026) | 67% | Market Decipher, 2026 |
| Brands with zero AI search mentions | ~90% | Victorious / Search Engine Journal, Q1 2026 |
| Agencies lacking centralized AI visibility dashboards | 62% | AirOps State of AI Search, 2026 |
| Brands maintaining consistent AI visibility across queries | 30% | AirOps / Kevin Indig, 2026 |
Key Insights:
- 92% of marketers plan to optimize for AI search.⁶ Meanwhile, roughly 90% of brands still carry zero AI search mentions.⁷
- The measurement problem compounds the execution gap: only 23% of marketers invest in GEO tracking, while roughly 90% of brands carry zero AI search mentions.⁷ Most organizations cannot quantify the visibility they are losing each month.
- For firms in architecture, engineering, construction, and real estate, this gap is a concrete advantage. Brands that establish AI citation credibility now face far less competition than they will in 12 to 18 months.
GEO Market by Segment: 2026
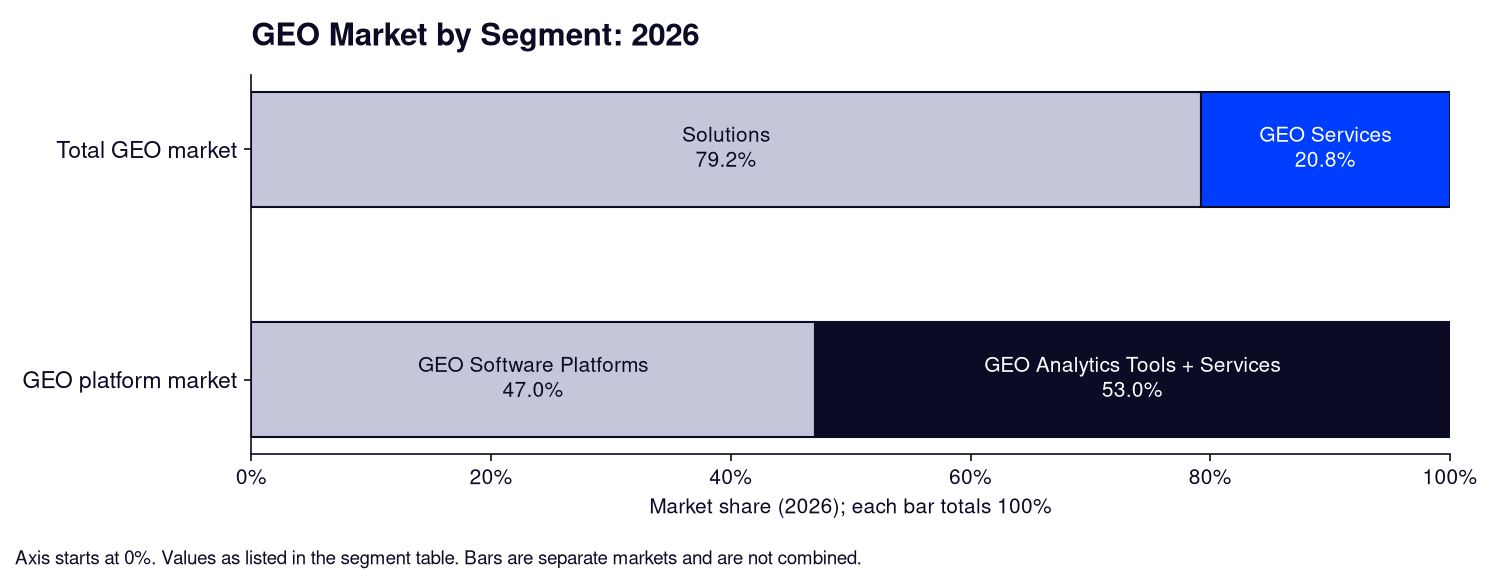
GEO revenue is distributed across software platforms, professional services, and deployment models. The table below shows how the market breaks down by segment in 2026.
The GEO Market Segment Composition: 2026
| Segment | Market Share (2026) | Key Driver |
|---|---|---|
| GEO Services (share of total GEO market) | 20.8% | Enterprise demand for coordinated, multi-discipline expertise |
| GEO Analytics Tools + Services (share of GEO platform market) | 53.0% | Combined analytics tools and services segment |
| GEO Software Platforms (share of GEO platform market) | 47.0% | Integration with existing SEO tools and CRM platforms |
| Cloud Deployment | 67.0% | Automated real-time content optimization at scale |
| On-Premise Deployment | 33.0% | Regulated industry data governance requirements |
| AI Visibility Monitoring (sub-segment of platforms) | 35.0% | Rising enterprise investment in citation-frequency tracking |
Key Insights:
- Services account for 20.8% of the GEO market, and they are its fastest-growing offering, because effective execution requires simultaneous expertise across technical SEO, content strategy, digital PR, and sentiment management.²¹ AI SEO services are among the fastest-growing line items in agency marketing budgets in 2026.
- Cloud deployment dominates at 67%. Real-time citation tracking and content scoring require continuous compute that on-premise infrastructure rarely supports at a viable cost.³
- The AI Visibility Monitoring sub-segment grew significantly after mid-2026 product launches. On June 10, 2026, Conductor and Optimizely launched an integrated AEO platform.³ On July 22, 2026, Pepper released a GEO platform for enterprise marketers targeting ChatGPT and Perplexity.³
AI Platform Scale and GEO Demand: 2026
GEO market growth is a direct function of AI search scale. The larger the AI search audience, the greater the value of appearing in AI-generated answers. The table below documents the current reach of the platforms that make GEO a strategic necessity.
The AI Platform Scale Driving GEO Investment: 2026
| Platform / Metric | Value | Source |
|---|---|---|
| ChatGPT weekly users (Oct 2026) | 1.2 billion | OpenAI, Oct 2026 |
| Google AI Overviews monthly users | 2.5 billion | Google I/O keynote, May 2026 |
| Google AI Mode monthly active users | 1 billion | Google / Search Engine Journal, May 2026 |
| Generative AI platform monthly web visits | 9.5 billion | Similarweb, June 2026 |
| YoY growth in generative AI platform visits | +70% | Similarweb, June 2026 |
| AI Overviews: share of US business-intent queries | 86.7% | Peec AI, April 2026 |
| AI Overviews: share of decision-stage queries | 88.5% | Peec AI, April 2026 |
| Searches ending without a click to a website | 60% | Bain & Company, Feb 2025 |
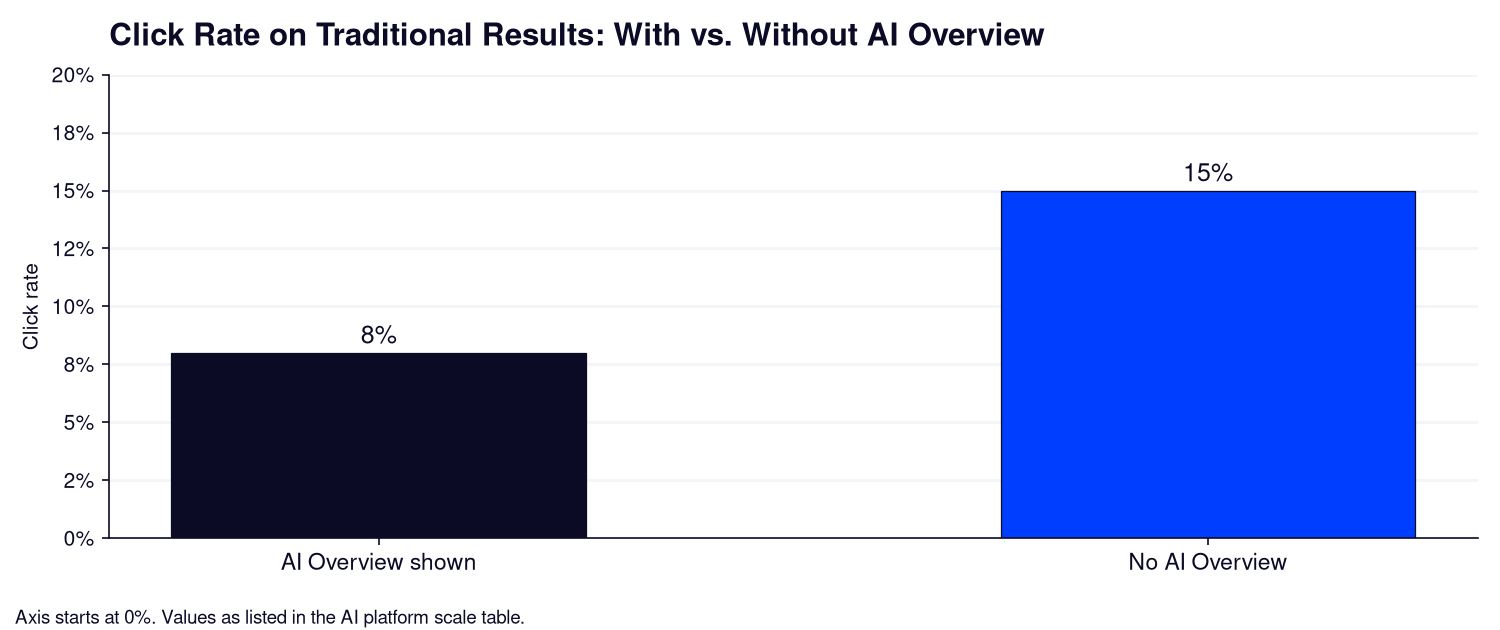
| Click rate on traditional results when AI Overview shown | 8% | Pew Research Center, Jul 2025 |
| Click rate on traditional results without AI Overview | 15% | Pew Research Center, Jul 2025 |
| AI-referred visitors: conversion rate advantage vs. organic | 23x | Ahrefs / Averi, 2025 |
| B2B buyers who used AI during their purchase process (2025) | 94% | 6sense Buyer Experience Report, 2025 |
| B2B software buyers starting vendor research in an AI chatbot | 51% | G2 Answer Economy Report, April 2026 |
| B2B buyers who chose a different vendor based on AI guidance | 69% | G2 Answer Economy Report, April 2026 |
Key Insights:
- When Google shows an AI Overview, users click a traditional search result only 8% of the time, versus 15% without one.⁸ At 86.7% AI Overview coverage on business queries, brands relying solely on organic rankings are structurally underexposed to their own target audience.⁵
- AI-referred visitors convert at 23x the rate of organic search visitors.⁹ Each AI citation carries revenue implications that rank position alone cannot replicate.
- Sixty-nine percent of B2B buyers chose a different vendor than they initially planned, based on AI chatbot guidance alone.¹⁰ For construction companies and AEC professionals, the buying shortlist is often finalized inside a chatbot before any direct contact occurs.
GEO Market Size Growth Projection (2025–2034)
The table below traces the projected trajectory of the global GEO market from 2025 through 2034. The 2026 and 2034 values are sourced from Dimension Market Research. Intermediate years are modeled.¹
The Global GEO Market Size Growth Trajectory: 2025 to 2034
| Year | Projected Global GEO Market Size | Data Type |
|---|---|---|
| 2025 | $848 million | Sourced (Dimension Market Research / Superlines) |
| 2026 | $1.09 billion | Sourced (Dimension Market Research, Feb 2026) |
| 2027 | $1.54 billion | Modeled (41.1% implied CAGR) |
| 2028 | $2.17 billion | Modeled |
| 2029 | $3.06 billion | Modeled |
| 2030 | $4.32 billion | Modeled |
| 2031 | $6.10 billion | Modeled |
| 2032 | $8.61 billion | Modeled |
| 2033 | $12.15 billion | Modeled |
| 2034 | $17.15 billion | Sourced (Dimension Market Research, Feb 2026) |
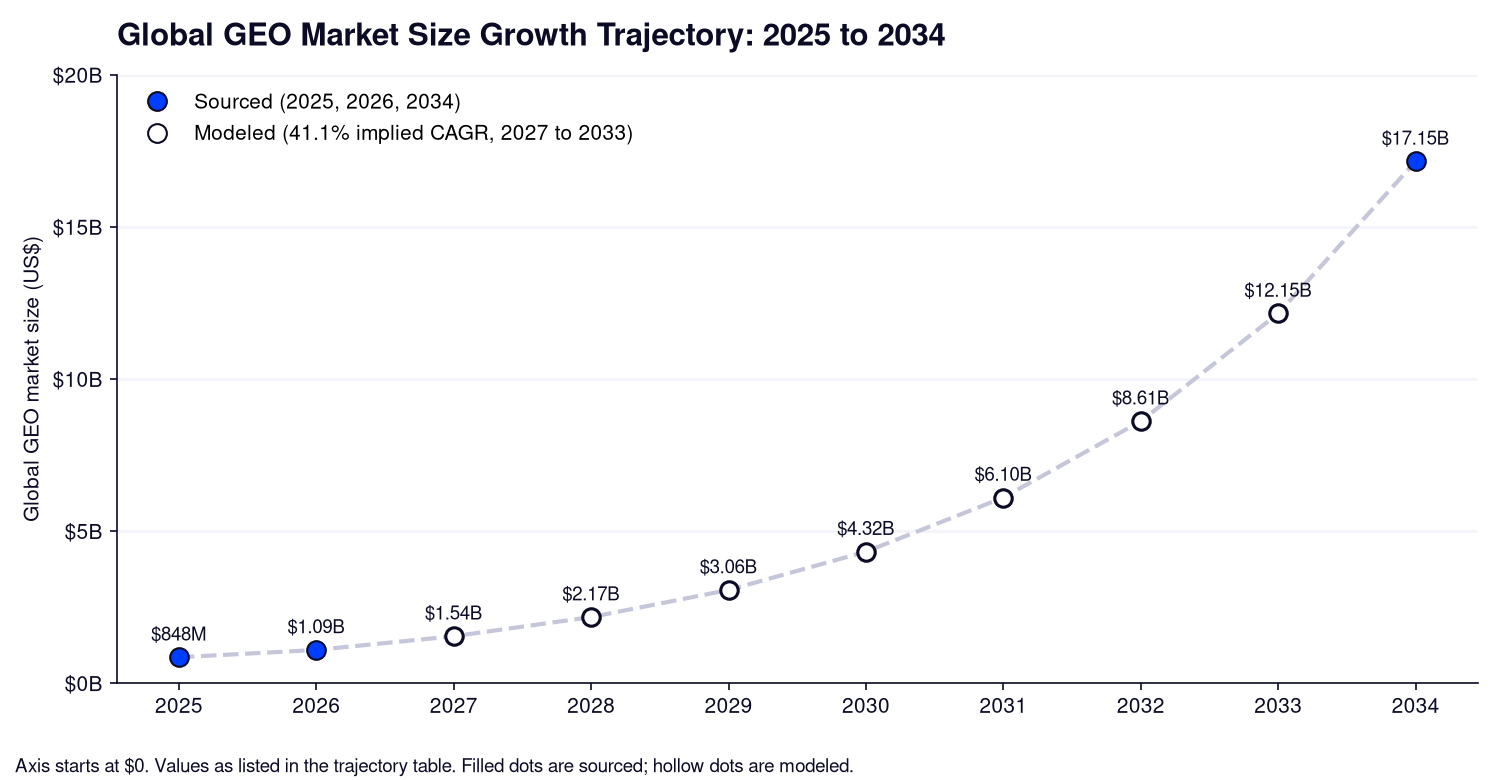
2027–2033 values are modeled estimates that grow at one constant rate from the sourced 2026 value ($1,089.3M) to the sourced 2034 value ($17,148.6M): ($17,148.6M ÷ $1,089.3M)^(1/8) − 1 ≈ 41.1% per year. Actual results will vary.
Requesting a Copy of This Report
The global GEO market grew 28.5% in a single year and is projected to exceed $17 billion by 2034. Brands that move from planning to implementation in 2026 will compound first-mover advantages that late entrants will struggle to close.
Siana Marketing is the only GEO agency built exclusively for the architecture, engineering, construction, and real estate sectors. If you'd like to request a PDF copy of this report or learn more about our agency, reach out here.
Last updated: October 2026
Sources
- Siana Marketing, GEO Market Size: 2026 Report. Miami, FL: October 2026.
- Dimension Market Research, Generative Engine Optimization (GEO) Market Size Report 2026–2034. February 2026. https://dimensionmarketresearch.com/report/generative-engine-optimization-geo-market/
- Coherent Market Insights, Generative Engine Optimization (GEO) Platform Market Size and Share Analysis — Growth Trends and Forecasts (2026–2033). 2026. https://www.coherentmarketinsights.com/industry-reports/generative-engine-optimization-geo-platform-market
- Market Decipher, $32.92 Billion GEO Market by 2036, 40% CAGR Growth. Yahoo Finance, 2026. https://finance.yahoo.com/technology/ai/articles/32-92-billion-geo-market-140100436.html
- Peec AI, 70+ Generative Engine Optimization (GEO) Statistics for 2026. August 2026. https://peec.ai/ai-search-geo-statistics
- ConvertMate, GEO Benchmark 2026. 2026. https://www.convertmate.io/research/geo-benchmark-2026
- Victorious / Search Engine Journal, Q1 2026 Quarterly Search Report: AI Search Citation Study. 2026. https://www.searchenginejournal.com/ai-seo-mentions-study-victorious-spa/575040/
- Pew Research Center, Google Users Are Less Likely to Click on Links When an AI Summary Appears in the Results. July 22, 2025. https://www.pewresearch.org/short-reads/2025/07/22/google-users-are-less-likely-to-click-on-links-when-an-ai-summary-appears-in-the-results/
- Ahrefs / Averi, AI Search Visitors Convert 23x Higher. 2025. https://www.averi.ai/blog/ai-search-visitors-convert-23x-higher.-everyone-s-ignoring-it.
- G2, Answer Economy Report. April 2026. https://www.g2.com/research/state-of-software/b2b-buyer-report
- Conductor, The State of AEO/GEO in 2026: CMO Investment Report. January 2026. https://www.conductor.com/academy/state-of-aeo-geo-report/
- OpenAI, GPT-6 and Intelligent UI for everyone. October 2026. https://openai.com/index/gpt-6-for-everyone/
