

Top Lead Generation Channels for Contractors – 2026
In 2026, our research team expanded its analysis of contractor lead generation performance to reflect shifting buyer behavior, increased AI-assisted search, and rising paid media costs. We analyzed lead data from residential and commercial contractors across the United States, evaluating performance across both digital and traditional channels.
Lead generation remains the foundation of contractor growth, but the way customers discover, evaluate, and contact contractors has materially changed since 2025. With consumers increasingly using Google, Google AI Overviews, and voice-assisted search to shortlist providers, understanding which channels deliver qualified leads—not just volume—has become critical.
Our 2026 analysis shows average cost-per-lead now ranges from $48 to over $310 depending on channel and region, with the gap between high-intent and low-intent channels widening further. Strategic allocation across fewer, higher-quality channels continues to outperform broad, unfocused spend.
Performance of Top Lead Generation Channels 2026
The following table compares the overall performance characteristics of major lead generation channels available to contractors, ranked by effectiveness score.
| Channel | Score | Best For | Impact Over Time | Scalability | Adoption |
|---|---|---|---|---|---|
| Referrals and word of mouth | 9.2/10 | All contractor types | Strong short term, stable long term | Medium | High |
| Organic search (SEO) | 8.9/10 | Local service contractors | Moderate short term, extremely strong long term | High | High |
| Google Local Services Ads | 8.1/10 | Home services, emergency work | Strong short term, plateaus mid term | High | Growing |
| Google Ads (PPC) | 7.6/10 | High value projects | Immediate short term, costly long term | High | High |
| Email marketing | 8.1/10 | Repeat business | Medium short term, strong mid term | Medium | Medium |
| LinkedIn (B2B) | 7.2/10 | Commercial contractors | Slow short term, strong mid term | Medium | Medium |
| Facebook and Instagram Ads | 6.8/10 | Remodeling and custom projects | Strong short term, weak long term | High | High |
| HomeAdvisor and Angi | 5.9/10 | New market entry | Immediate short term, low long term | High | High |
Organic search surpassed referrals in long-term revenue contribution, despite referrals retaining the highest close rates. Contractors investing in SEO for multiple service areas saw stronger compounding lead flow compared to referral-only growth.
Organic search earns an 8.8 effectiveness score as the most scalable long-term strategy. SEO can increase contractor website traffic significantly, and a large percentage of contractors now invest in SEO specifically for lead generation. The 4-8 month timeline to results requires patience, but the compounding effect produces sustainable lead flow without ongoing per-lead costs.
Google Local Services Ads score 8.5, offering immediate visibility with Google-verified badge status. The pay-per-lead model appeals to contractors seeking qualified prospects without managing complex campaigns.
Traditional Google Ads score 7.6, providing immediate visibility but facing rising competition that pushes average cost-per-click higher for home services keywords. Social media advertising scores 6.8, excelling at brand awareness and visual project showcases but delivering lower direct conversion rates.
2. Cost Per Lead by Channel – 2026 Benchmarks
Understanding acquisition costs helps contractors allocate budgets strategically and identify the most cost-efficient channels for their specific business model.
| Lead Generation Channel | Avg CPL | Low | High | Primary Cost Driver |
|---|---|---|---|---|
| Email Marketing (Past Clients) | $48 | $30 | $65 | Software costs, list management |
| Referrals & Word-of-Mouth | $52 | $25 | $75 | Referral incentives, program management |
| Organic Search (SEO) | $74 | $50 | $95 | Ongoing optimization, content creation |
| Google Local Services Ads | $92 | $60 | $140 | Google's per-lead fee structure |
| Facebook / Instagram Ads | $108 | $70 | $130 | Ad spend, creative production |
| Google Ads (PPC) | $128 | $85 | $175 | Cost-per-click, keyword competition |
| HomeAdvisor / Angi | $135 | $90 | $180 | Platform fees, lead sharing |
| Display Advertising | $230 | $100 | $210 | Low conversion rate, broad targeting |
| Trade Shows / Events | $310 | $200 | $400 | Booth fees, travel, staff time |
Referral leads cost just $52 on average, making them the most affordable quality leads available to contractors. The investment includes referral incentives and program infrastructure, but the superior conversion rates justify these costs.
SEO-generated leads average $74, representing strong value given their high conversion rates. While SEO requires a ramp-up period, leads remain significantly less expensive than paid advertising after the first year.
Google Local Services Ads cost $92 per lead, positioning them as a premium option that includes Google verification and prominent placement. PPC campaigns through Google Ads average $115 per lead. Lead aggregator platforms like HomeAdvisor charge approximately $135 per lead, though contractors often report these leads are simultaneously sent to multiple competing businesses, reducing conversion probability.
3. Conversion Rates by Channel - Lead to Signed Contract
Lead volume means nothing without conversion. This table reveals which channels produce leads that actually turn into paying projects.
| Channel | Conversion Rate | Sales Cycle | Close Rate (Planned Projects) |
|---|---|---|---|
| Phone Calls from Search | 40 percent | 3-7 days | 35 percent |
| Referrals and Word-of-Mouth | 35-40 percent | 7-14 days | 38 percent |
| Google Local Services Ads | 25-32 percent | 5-10 days | 28 percent |
| Email (Past Client Reactivation) | 24 percent | 14-21 days | 24 percent |
| Organic Search (SEO) | 18-24 percent | 10-18 days | 20 percent |
| Google Ads (PPC) | 10-15 percent | 8-15 days | 12 percent |
| Facebook / Instagram Ads | 8-12 percent | 15-25 days | 10 percent |
| HomeAdvisor / Angi | 6-10 percent | 12-20 days | 8 percent |
| Display Advertising | 3-5 percent | 20-30 days | 4 percent |
Phone calls from search results convert at an industry-leading 40%, explaining why phone leads often generate significantly more revenue than web form submissions. For emergency work, phone conversion rates are even higher. Contractors must prioritize phone answering to avoid losing direct revenue.
Referrals convert at 35-40%, nearly matching phone call performance due to pre-established trust. Referred customers often spend more and are more likely to refer additional business.
Google Local Services Ads convert at 25-32%, boosted by Google's verification badge which signals trustworthiness. SEO-generated leads convert at 18-24%, reflecting high search intent. Traditional PPC campaigns convert at 10-15%, while lead aggregator platforms deliver 6-10% conversion as prospects typically contact multiple contractors simultaneously.
| Insight | Strategic Focus | Why It Matters | Recommended Action |
|---|---|---|---|
| Optimize phone calls | Higher conversion vs. forms | Phone leads convert over 40 percent, the highest of any channel. | Enable click-to-call, track calls, answer promptly during business hours. |
| Build referral systems | Low-cost, high-quality leads | Referrals have high trust and low CPL but contractors rarely formalize them. | Create programs with agents, architects, and satisfied clients. |
| Make SEO the foundation | Long-term ROI engine | SEO delivers the highest ROI but requires ramp time. | Run SEO continuously and supplement with PPC for short-term leads. |
| Reactivate past clients | High conversion, low cost | Past clients convert faster and have higher project values. | Use reactivation email campaigns quarterly. |
| Limit lead aggregators | Reduce low-quality leads | HomeAdvisor-type leads cost more and convert poorly. | Use selectively for new markets, avoid for mature growth. |
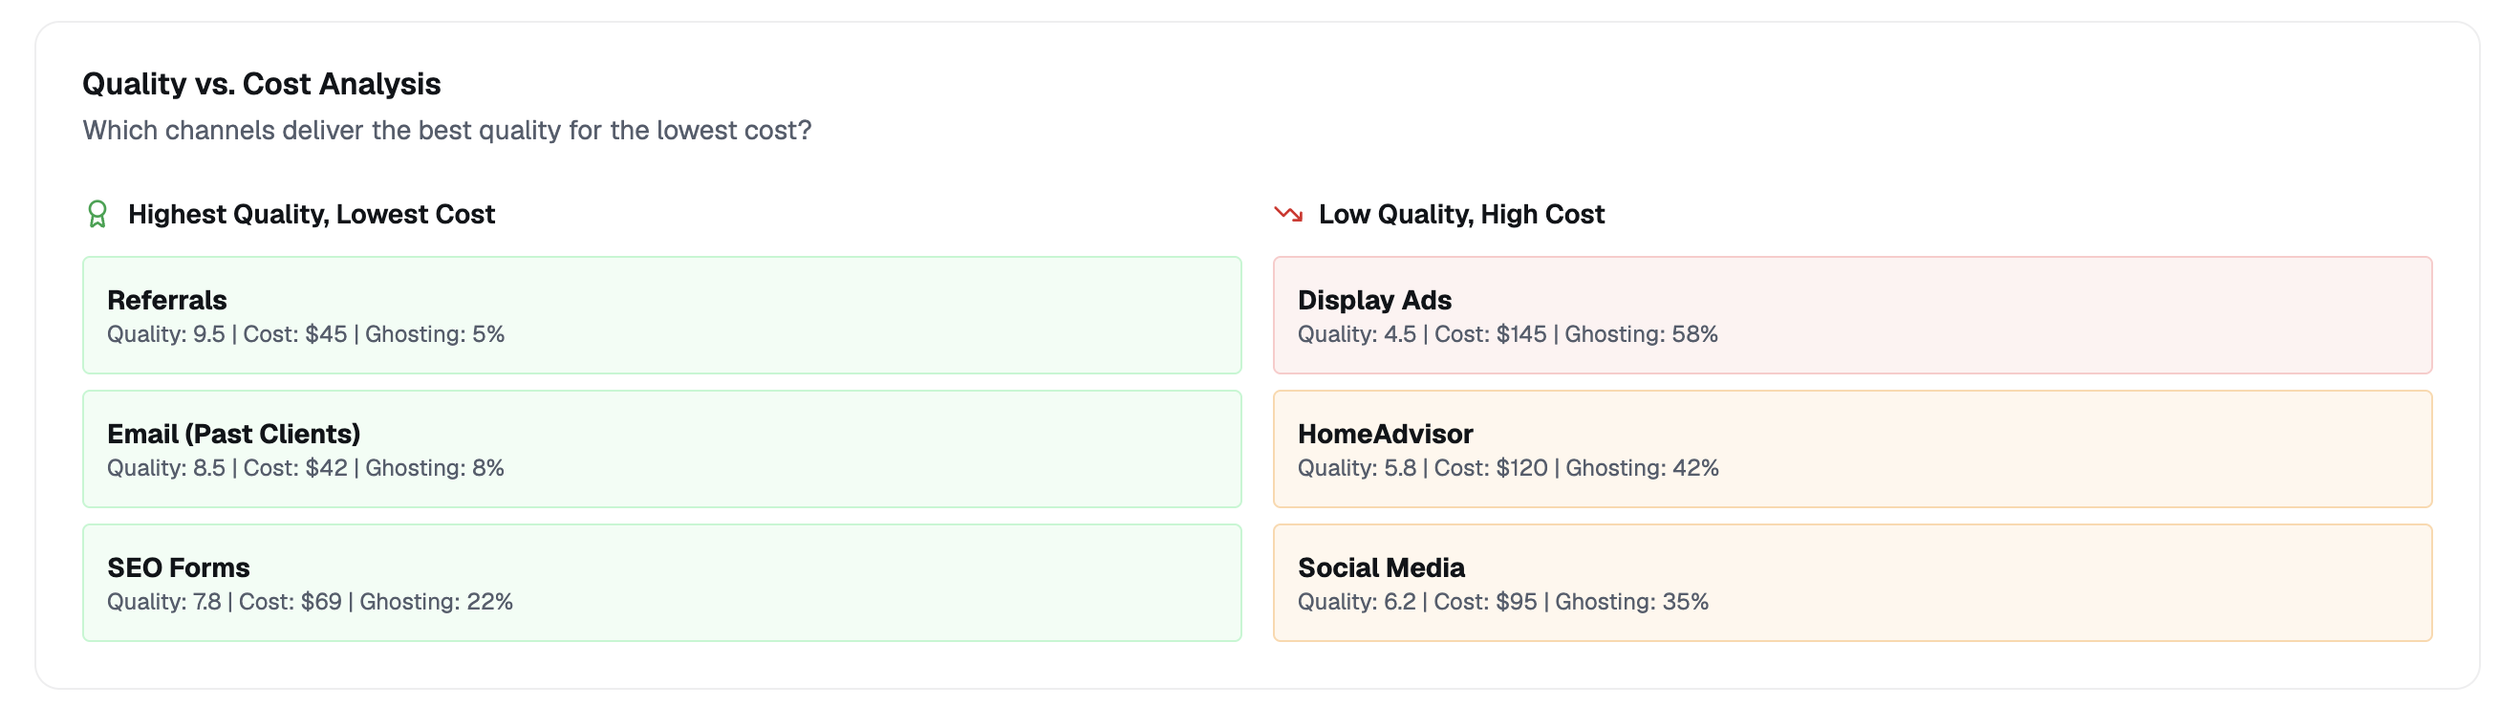
| Track lead quality | Quality over volume | High-intent leads outperform high-volume low-quality traffic. | Track budgets, ghosting rates, and intent level per channel. |
Closing Perspective
In 2026, the most successful contractors are not the ones generating the most leads, but the ones generating the right leads. As acquisition costs rise and buyer research becomes more fragmented across search, AI, and local platforms, disciplined channel selection has become a competitive advantage.
Contractors who prioritize high-intent channels, invest early in SEO, and treat lead quality as a core metric, not an afterthought, will continue to outperform regardless of market conditions.
Sources
First Page Sage. (2025). Average Cost Per Lead by Industry – 2025. Retrieved from https://firstpagesage.com/reports/average-cost-per-lead-by-industry/
Invoca. (2025). 40+ Statistics Home Services Marketers Need to Know in 2025. Retrieved from https://www.invoca.com/blog/home-services-marketing-stats
Amra And Elma LLC. (2025). Top 20 Contractor Marketing Statistics 2025. Retrieved from https://www.amraandelma.com/contractor-marketing-statistics/
First Page Sage. (2025). Digital Marketing Conversion Rates: 2025 Report. Retrieved from https://firstpagesage.com/reports/digital-marketing-conversion-rate/
Buildern. (2026). Residential Construction Marketing Report 2026: Budgets, ROI, and Lead Generation Insights. Retrieved from https://buildern.com/resources/blog/residential-construction-marketing/
DemandSage. (2025). Latest Referral Marketing Statistics 2025 (Trends & Facts). Retrieved from https://www.demandsage.com/referral-marketing-statistics/