

How Do Architects Get Clients? [2026 Industry Metrics Report]
Our research team analyzed industry surveys and marketing performance data from 2024 through the end of 2025, combined with AIA firm reports, proposal benchmarks, and digital marketing datasets, to measure how U.S. architecture firms acquire new clients across different channels heading into 2026.
We calculated percentage share of new clients as leads converted into signed projects from each channel divided by total new clients, then evaluated cost efficiency, conversion rates, and long-term client value. To ensure accuracy, results are weighted by firm size, project typology, and procurement complexity. Larger firms with institutional and public-sector work carry proportionally more influence in competitive pursuit percentages, while smaller residential and boutique practices weight referral and organic channels more heavily. This methodology provides both macro industry insight and firm-size context, highlighting where relationships, digital visibility, or formal procurement drive client acquisition most effectively.
Client Acquisition Channel Breakdown for Architecture Firms (2026)
The table below highlights the estimated percentage of new clients acquired through each major channel, updated to reflect late-2025 behavior and early-2026 trends. Alongside the metrics, we explain why certain channels continue to dominate while others underperform, connecting numbers to real business drivers.
| Channel | % of New Clients (2025) | Trend vs. 2020 | Key Insights |
|---|---|---|---|
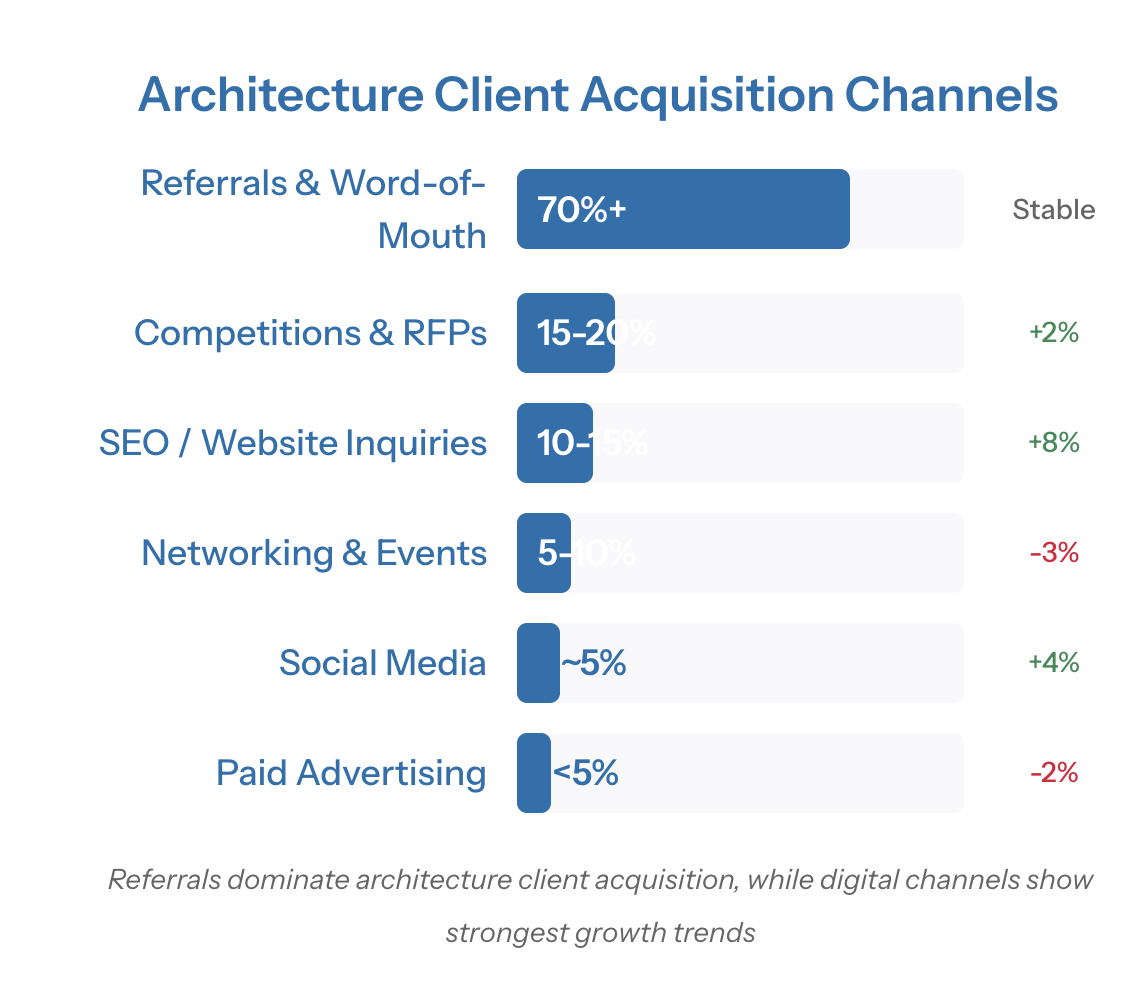
| Referrals & Word-of-Mouth | 70% | Stable | Trust-based industry where reputation drives business; existing clients and professional networks remain primary source |
| Competitions & RFPs | 15-20% | +2% | Essential for public/institutional work; higher for large firms, minimal for residential practices |
| SEO / Website Inquiries | 10-15% | +8% | Rising as clients research online first; younger demographics driving growth in organic search |
| Networking & Events | 5-10% | -3% | Still valuable but declining post-COVID; quality over quantity in professional connections |
| Social Media | ~5% | +4% | Growing slowly; Instagram for portfolios, LinkedIn for B2B networking; indirect lead generation |
| Paid Advertising | <5% | -2% | High cost, low conversion; most firms avoid due to budget constraints and poor ROI |
Industry Takeaway: Architecture remains fundamentally relationship-driven, but digital discovery now meaningfully influences early shortlists, especially for residential, mixed-use, and commercial projects.
Cost Per Lead and Conversion Rates by Marketing Channel (2026)
Looking beyond volume, efficiency determines which channels justify sustained investment. The table below compares average cost per lead, conversion likelihood, and effective cost per signed client.
| Channel | Average Cost Per Lead | Conversion Rate | Effective Cost Per Client | ROI Assessment |
|---|---|---|---|---|
| Referrals | ~$0 | 50%+ | ~$0 | Excellent - Zero marketing cost, highest close rate |
| SEO/Organic | $150-300 | 5-15% | $1,000-6,000 | Good - Moderate cost, sustained traffic over time |
| Networking | $100-400 | 10-25% | $400-4,000 | Variable - Depends on event quality and follow-up |
| Competitions/RFPs | $2,000-5,000* | 25-30% | $7,000-20,000 | Necessary - High cost but required for large projects |
| Social Media | $200-500 | 3-8% | $2,500-16,700 | Emerging - Long-term brand building, indirect benefits |
| Paid Ads | $280+ | 2-10% | $2,800-14,000 | Poor - Highest cost, lowest conversion for most firms |
*RFP cost represents internal pursuit cost (staff time and overhead) per proposal, not per inbound lead.
Efficiency Takeaway: Referrals remain unmatched, while organic search now offers the best balance of scalability and cost control. Paid ads continue to underperform for most architecture practices.
Project Size and Client Value by Acquisition Channel (2026)
Not all acquisition channels deliver equal project scope or lifetime value. This breakdown shows how project size, relationship depth, and repeat business vary by source.
| Channel | Average Project Value | Client Relationship Type | Repeat Business Rate |
|---|---|---|---|
| Referrals | High ($50K-500K+) | Long-term, trusted | 60-80% |
| Competitions/RFPs | Very High ($100K-2M+) | Project-specific | 40-60% |
| Networking | High ($40K-300K+) | Relationship-based | 50-70% |
| SEO/Organic | Medium ($15K-100K) | Research-driven | 30-50% |
| Social Media | Medium ($20K-150K) | Brand-attracted | 25-45% |
| Paid Ads | Low-Medium ($5K-75K) | Price-shopping | 15-30% |
Value Takeaway: Referral and networking-sourced clients not only close at higher rates but also bring larger projects and greater lifetime value through repeat business.
Key Marketing Trends Reshaping Architecture Firms in 2026
Several structural shifts continue to reshape how architecture firms approach client development.
1. AI and Automation Adoption
Current adoption: 8-12% of firms actively integrate AI into marketing workflows
Adoption momentum: Over 50% have experimented with AI tools, with one-third planning structured implementation
Primary uses: Proposal drafting, site analysis summaries, authority content, marketing personalization
Impact: Firms using AI report 35-45% time savings in marketing and pursuit preparation
2. Digital-First Client Research
Search behavior: 42% of homeowners and private developers now research architects online first
Budget movement: Ongoing shift from print and sponsorships to SEO and authority content
Competitive pressure: Visibility in Google and AI-powered search now influences shortlists before first contact
Results: Firms ranking consistently report 30-45% growth in qualified inbound inquiries
3. Continued Decline of Traditional Outreach
Print advertising: Minimal impact for most firm sizes
Trade shows: Broad expos declining; targeted, relationship-driven events performing better
Spend reallocation: From broad awareness to relationship amplification and digital authority
ROI reality: Traditional channels produce low attribution and limited measurable returns
Trend Takeaway: 2026 confirms the transition. Relationship capital remains essential, but digital authority and AI visibility are now table stakes, not optional add-ons.
For a complete copy of our Architecture Firm Marketing Benchmark Report, including regional data, firm-size segmentation, and 2026 projections, please contact us here.For a complete copy of our Architecture Firm Marketing Benchmark Report, including regional breakdowns and firm-size analysis, please contact us here.