

Architect Fee Percentage by Project Phase: 2026 Report
This report provides a 2026 benchmark analysis of architectural fee percentages by project phase, drawing on updated data from the American Institute of Architects, the Royal Architectural Institute of Canada, and recent industry publications. The objective is to establish current, decision-ready fee benchmarks for architects, developers, and property owners navigating increasingly complex projects.
As projects enter 2026, fee structures continue to reflect higher documentation demands, earlier technical coordination, and expanded construction administration scope, reinforcing the need for clearer phase-based budgeting.
1. Architect Fee Percentage by Project Phase - 2026
The most common method for structuring architectural fees remains phase-based allocation. However, 2026 data shows subtle but important redistribution toward early-stage services and construction administration.
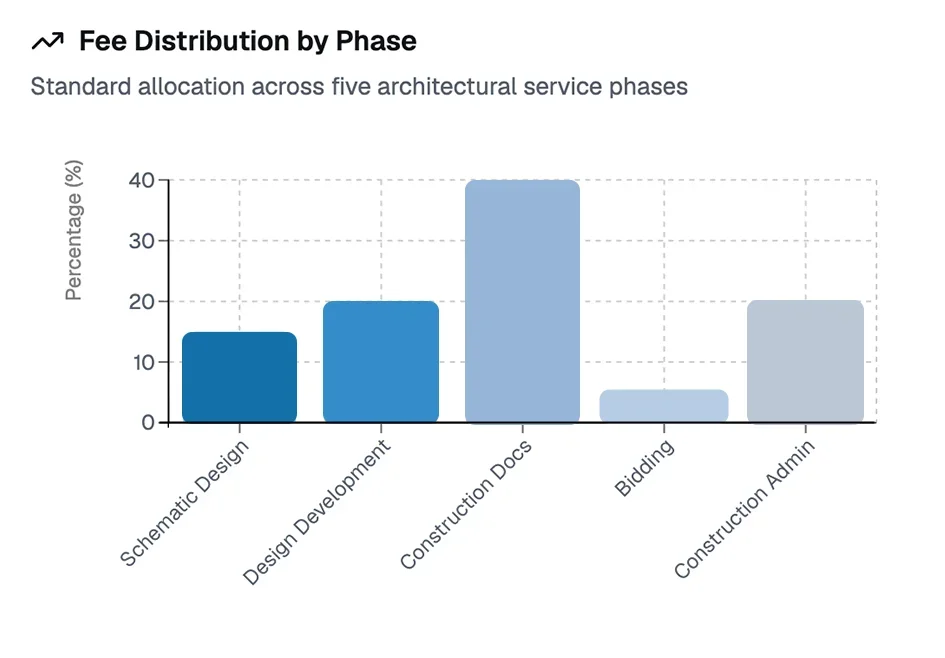
| Project Phase | Typical Fee Percentage | Typical Range | Description |
|---|---|---|---|
| Schematic Design (SD) | 15% | 10% to 20% | Initial design concepts, preliminary drawings, basic floor plans |
| Design Development (DD) | 20% | 15% to 25% | Refinement of design, material selection, detailed specifications |
| Construction Documents (CD) | 40% | 35% to 50% | Complete technical drawings, specifications, permit documents |
| Bidding and Negotiation | 7% | 5% to 10% | Contractor selection, bid review, contract negotiation |
| Construction Administration (CA) | 22% | 15% to 30% | Site visits, progress reviews, project closeout |
Key Findings:
Construction Documents remain the largest single fee component, though their share has slightly declined as more coordination shifts earlier.
Early design phases now represent ~37% of total fees, reflecting front-loaded technical and sustainability requirements
Construction Administration continues to expand, driven by supply chain volatility and increased coordination demands
2. Architect Fee Percentage by Service Level - 2026
Fee structures remain diverse, but percentage-of-construction-cost models continue to dominate full-service engagements, especially in residential and mixed-use projects.
| Service Level | Fee Structure | Typical Cost | What’s Included | Best For |
|---|---|---|---|---|
| Initial Consultation | Hourly | $150 to $500 per session | Site review, feasibility discussion, preliminary advice | Early stage planning |
| Schematic Design Only | Fixed Fee | $2,000 to $10,000 | Concept drawings, basic floor plans, elevations | Design build projects |
| Full Service (No CA) | Percentage of construction cost | 6% to 10% | All phases except construction administration | Experienced developers |
| Full Service with CA | Percentage of construction cost | 8% to 15% | All six phases including construction administration [8] | Most residential clients |
| Construction Administration Only | Percentage of construction cost | 3% to 5% | Site visits, RFIs, change orders, inspections | Design build handoffs |
| Hourly Consulting | Hourly | $100 to $250 per hour | Flexible scope, as needed services | Small projects or advice only |
Key Insights:
Full-service with CA remains the dominant model, now trending toward the upper end of historical ranges
Hourly rates have increased modestly, reflecting higher liability and specialization requirements
Developers increasingly unbundle CA when risk tolerance allows.
3. Architect Fee Percentage by Project Phase for BIM Projects - 2026
BIM-enabled projects continue to reallocate fees toward earlier phases, reinforcing the shift from reactive coordination to proactive modeling.
| Project Phase | Percentage of Total Fee (BIM Projects) | Traditional Project Percentage | Difference |
|---|---|---|---|
| Schematic Design | 20% to 25% | 15% | +5% to +10% |
| Design Development | 20% to 25% | 20% | 0% to +5% |
| Construction Documents | 25% to 35% | 40% | -5% to -15% |
| Bidding and Negotiation | 2.5% to 5% | 5% | -2.5% to 0% |
| Construction Administration | 20% to 25% | 20% | 0% to +5% |
Key Findings:
BIM concentrates effort in SD and DD, where coordination yields the highest downstream value
Reduced CD percentage reflects fewer late-stage conflicts and revisions
CA effort remains elevated due to model-based field coordination
4. Architect Fee Percentage by Project Type - 2026
Fee percentages continue to vary widely by project type, with risk, documentation burden, and coordination intensity driving pricing more than project size alone.
| Project Type | Typical Fee Range (% of Construction Cost) | Low End | High End | Complexity Factor |
|---|---|---|---|---|
| Residential — New Custom Home | 10% to 15% | 8% | 20% | Moderate to High |
| Residential — Major Renovation | 12% to 20% | 10% | 25% | High due to existing conditions |
| Commercial — Office or Retail | 6% to 10% | 5% | 12% | Moderate |
| Institutional — Schools or Healthcare | 8% to 12% | 6% | 15% | High |
| Industrial or Warehouse | 4% to 8% | 3% | 10% | Low to Moderate |
| High End Custom Residential | 12% to 18% | 10% | 25% | Very High, often includes interior design |
Key Insights:
Residential renovation and remodel projects command 15-25% higher fees than new construction due to the complexity of working with existing conditions, code compliance challenges, and the need for extensive documentation of as-built conditions.
Commercial architectural fees have evolved from a traditional 6% standard to 8-12% in 2025, reflecting increased code complexity, sustainability requirements, and technology integration demands
Industry Trends Affecting Architect Fees in 2025
Early-phase workload continues to expand due to BIM, energy modeling, and zoning complexity
Sustainability is no longer optional, increasing baseline fees by 5–10% across most project types
Construction Administration scope has grown 20–30% since 2020, driven by coordination complexity rather than site presence alone
Requesting a Copy of This Report
This comprehensive breakdown of architect fee percentages by project phase provides essential benchmarks for budgeting architectural services in 2026.
For real estate developers, construction professionals, and design industry stakeholders, accurate fee projections are critical for project feasibility analysis and budget management.
Sources
ASD (Automated Systems Design). "Architectural Design 101 – The Phases, Fees & Deliverables Behind Your Project." April 2021. https://www.asd-usa.com/blog/architectural-design-phases
Fontan Architecture. "5 Architecture Phases Of Design Explained." Updated May 2024. https://fontanarchitecture.com/architectural-design-phases/
Architekwiki. "Architectural Fee As A Percent Of Construction Cost." March 2017. https://www.architekwiki.com/wiki/architectural-fee-as-a-percent-of-construction-cost
Cove.tool Help Center. "Phases of Design, Fees, and Deliverables." 2022. https://help.covetool.com/en/articles/6390200-phases-of-design-fees-and-deliverables
Monograph. "Guide to Architectural Design Phases." June 2024. https://monograph.com/blog/guide-to-design-phases
Neumann Monson Architects. "Basic vs. Supplemental Services: Breaking Down Architecture Fees." October 2021. https://neumannmonson.com/blog/basic-vs-supplemental-services-architecture-fees
Royal Architectural Institute of Canada (RAIC). "Determining Appropriate Fees for the Services of an Architect." 2019 Fee Guide. https://raic.org/sites/raic.org/files/nov2020_2019_fee_guide_en_web_4.pdf
RendAir AI. "Residential vs Commercial Architecture: A Cost Breakdown." 2024. https://www.blog.rendair.ai/residential-vs-commercial-architecture-cost-breakdown/
Architectural Fees. "Commercial Architectural Fees." 2024. https://architecturalfees.com/commercial-architectural-fees/
Maxx Designers. "Typical Architectural Fees for Commercial Projects in Texas: A Detailed Guide." 2024. https://www.maxxdesigners.com/typical-architectural-fees-for-commercial-projects-in-texas-a-detailed-guide/
CAD Crowd. "Complete Billable Rates for Architect Design Services." 2024. https://www.cadcrowd.com/blog/billable-rates-for-architects-design-services-architectural-costs-hourly-fees/
Siana Marketing. (2025 ). "Architecture Fees by State: 2025 Comprehensive Report." Retrieved from: https://www.sianamarketing.com/resources/architecture-fees-by-state-2025-comprehensive-report